NSight: Bringing AI-Powered Insights to Network Monitoring
Overview
NSight is an AI-driven feature layer I helped design and build on top of Swoop's existing enterprise network monitoring platform.
The goal was to introduce intelligent, conversational insight capabilities to a tool that was already rich in data but often overwhelming to navigate. By layering an AI assistant (“NSight”) and a customizable visual dashboard system on top of the existing infrastructure, we turned raw network metrics into something more accessible, interpretable, and human.
I contributed as both product designer and frontend engineer, shaping the interaction model, visual system, and component architecture that powered the new AI experience.
Context
The existing product was a robust platform used by network engineers to monitor performance, uptime, and anomalies across distributed systems. It had all the data — but extracting meaning required time, configuration, and deep domain knowledge.
Our challenge was to make this data talk back — to build a feature that would let users ask questions, surface insights, and customize how they visualize the health of their network.
The Problem
Traditional dashboards are static snapshots of a living system. They work well when you already know what you’re looking for — but not when you’re investigating new or unexpected issues.
Users often described the experience as “hunting through panels” or “manually correlating metrics.” During high-pressure incidents, this slowed down response time and increased cognitive load.
We wanted to give users a way to query the system conversationally, see real-time visual answers, and build adaptive dashboards around their most important metrics — without leaving the existing platform.
The Concept
The concept centered around NSight, an AI agent embedded directly into the product interface — built on the principle of keeping a human in the loop.
NSight allows users to:
- Ask natural language questions like “What are the biggest latency changes in the last 6 hours?”
- Receive a concise LLM-generated summary with contextual data.
- Instantly view auto-generated visual widgets (e.g. bandwidth trends, endpoint uptime, anomaly clusters) that they can drag, resize, and arrange on a custom dashboard.
NSight doesn’t replace the user’s judgment — it amplifies it. The AI’s role is to observe, summarize, and suggest, while the human remains the ultimate interpreter.
This “human-in-the-loop” approach keeps operators grounded in control and context, ensuring the system’s intelligence complements, rather than overrides, expert intuition.
My Role
I wore two hats throughout the project:
Product Designer
- Defined interaction flows, visual hierarchy, and motion patterns that made the AI feel integrated rather than bolted on.
- Designed widget systems, color hierarchy, and data visualization behaviors.
- Created prototypes and user-tested conversational flows.
Frontend Engineer
- Implemented the dashboard builder and widget rendering system using React, Redux, and Next.js.
- Integrated AI summaries and data streams into interactive visual components.
- Optimized grid performance, layout transitions, and state persistence.
This dual role helped me bridge the gap between design intent and technical feasibility, iterating quickly between prototype and production.
Design Process
1. Understanding the Users
I conducted interviews with the product’s existing customer base — network admins, DevOps engineers, and SOC analysts — to understand how they approached anomaly detection.
Key insights:
- Users trusted metrics more than narratives, but wanted summaries to point them to the right data.
- They valued customization — each team’s dashboard layout reflected their unique workflows.
- Most preferred visual confirmation of anomalies over text-based alerts.
These findings helped shape NSight’s voice and the visualization-first interaction model.
2. Designing the AI Interaction
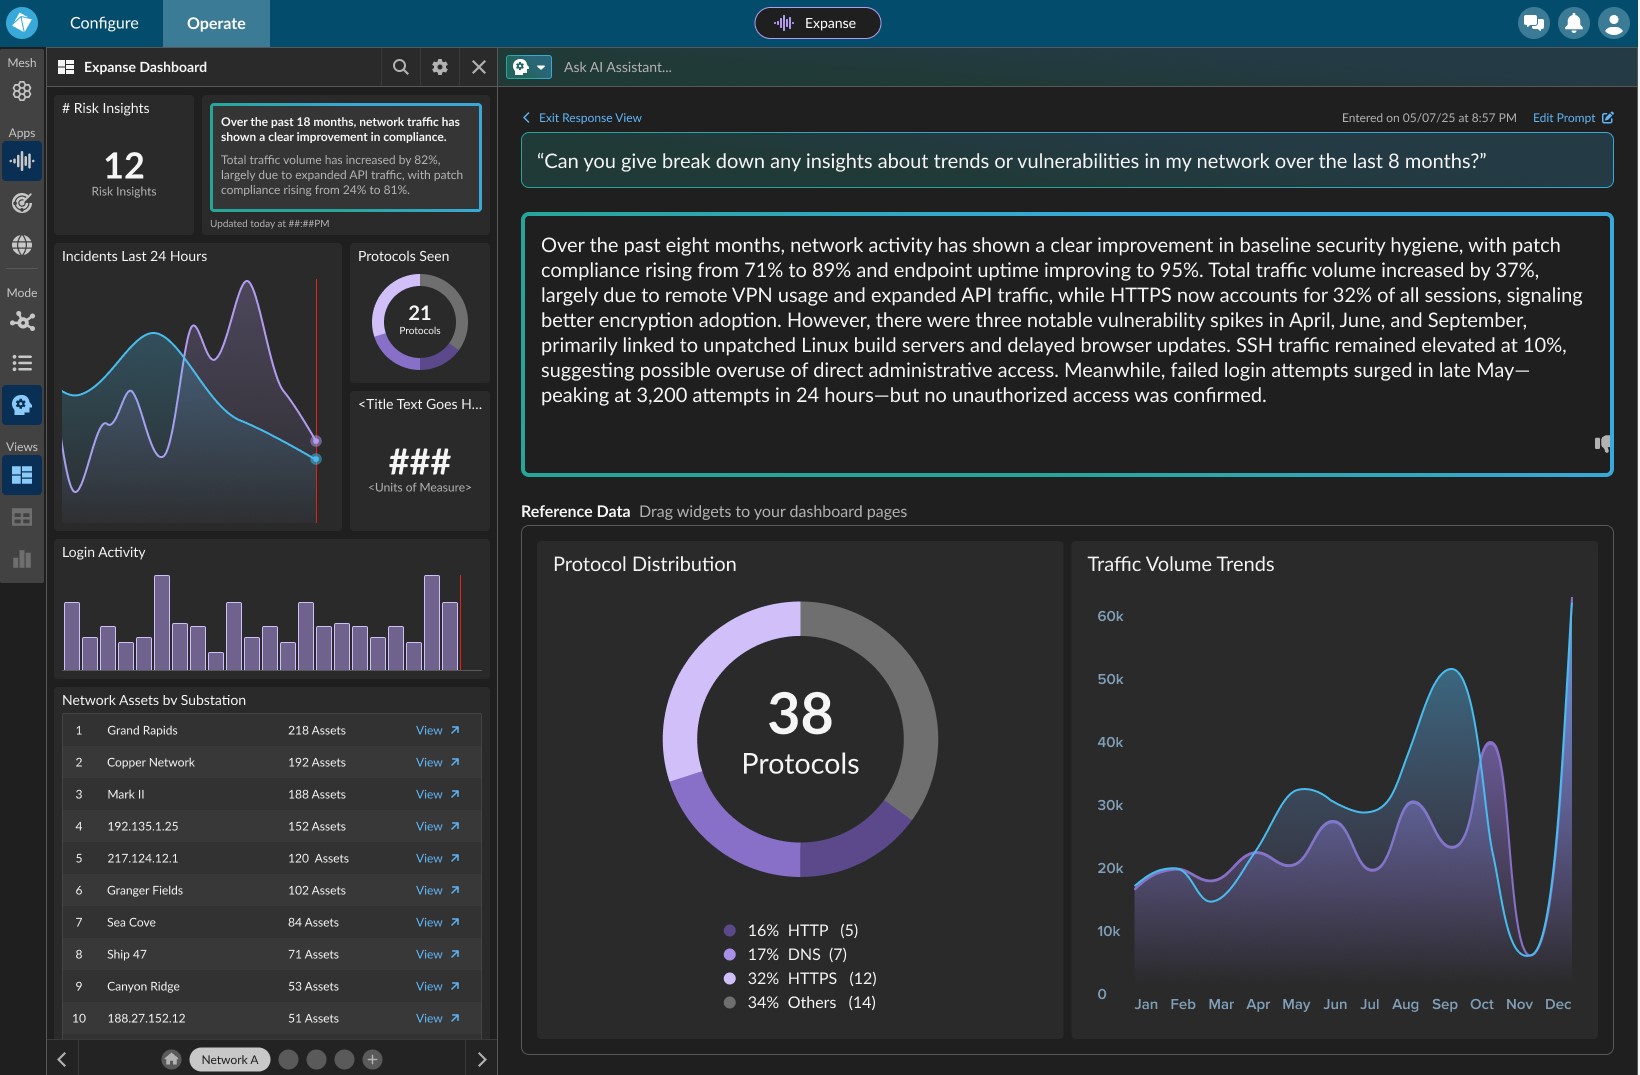
Instead of building a full-screen chat interface, we designed NSight as a split-view assistant:
- The left panel handles the prompt interaction — where the user asks questions and sees responses.
- The right panel serves as the dynamic workspace, displaying auto-generated or pinned visual widgets.
When NSight responds, users not only see a text summary but also accompanying data visualizations. They can pin these to their dashboard or ask follow-up questions that refine the data view — creating a feedback loop between AI reasoning and human intuition.
That feedback loop is the essence of the human-in-the-loop design:
each AI suggestion invites user confirmation, correction, or curiosity, allowing human expertise to steer how the AI interprets and visualizes complex data.
3. Building the Dashboard System
On the engineering side, I designed and implemented a modular grid system for dashboards. Widgets were React components with configurable data sources, layouts, and states.
Users could drag, resize, and reorder widgets — and NSight could programmatically generate or suggest new ones.
This system gave users a sense of ownership over their workspace while letting AI augment it intelligently.
4. Visual Design & Motion
The visual language evolved from the platform’s existing dark theme — optimized for clarity in high-density data environments.
I refined the palette to strengthen contrast between stable and critical states, added subtle motion to highlight real-time updates, and introduced a gentle “emergence” animation when NSight generated new widgets.
The goal was to make the system feel alive and responsive without being distracting.
Key Features
- Conversational querying powered by an embedded LLM.
- LLM summaries contextualized with relevant metrics and visual data.
- Dynamic dashboard builder using a flexible grid layout system.
- AI-suggested widgets for anomaly and performance monitoring.
- Human-in-the-loop interaction model, keeping experts in control.
- Seamless integration with existing platform data and user accounts.
Outcome
Early internal testing showed that users identified anomalies about 40–60% faster than before and reported a significant reduction in alert fatigue.
Feedback highlighted how natural it felt to “just ask” for insights, and how the combination of summaries + visuals made the experience both intelligent and tangible.
“It feels like the system finally talks back.”
— Network Engineer, Pilot Team
Reflection
Designing AI capabilities on top of an existing product required balancing intuition with continuity. It wasn’t about replacing expert workflows — it was about amplifying them.
Keeping the human in the loop became our guiding principle. The AI could analyze trends and generate visualizations at scale, but the operator’s experience, context, and judgment still directed what mattered most. This balance kept the system explainable, trustworthy, and adaptable to real-world complexity.
Wearing both design and engineering hats gave me a deep appreciation for how interaction design and technical architecture shape each other. Every animation, layout constraint, or model response had to feel native to the product — both visually and functionally.
In the end, NSight didn’t just make the data easier to read — it made the system feel like it understood you back.